Morphological Description
Life History
Distribution
Habitat
Roost Sites and Roosting Patterns
Emergence and Flight Pattern
Foraging Behaviour
Echolocation Calls
Status and Protection |
|
|
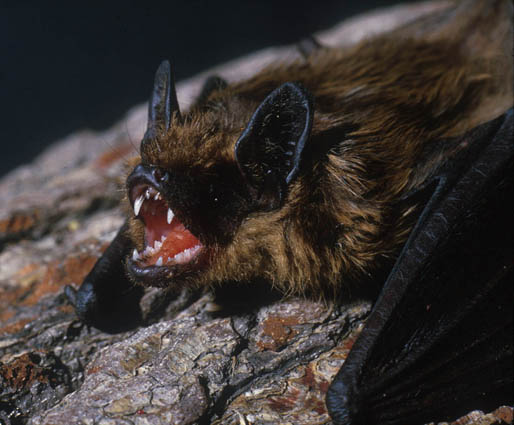
Morphological Description
- Dorsal fur is rich dark brown. Ventral fur is a paler shade of brown.
- Juveniles are darker in colour.
- Serotines have a post-calcarial lobe and a long, thin tragus with a blunt tip. The forearm is longer than 40mm, and the tail extends 2-6mm beyond the wing membrane.
- Adult males have a short, blunt penis.
- Average weight (as given by Greenaway & Hutson, 1990) 15-35 g.
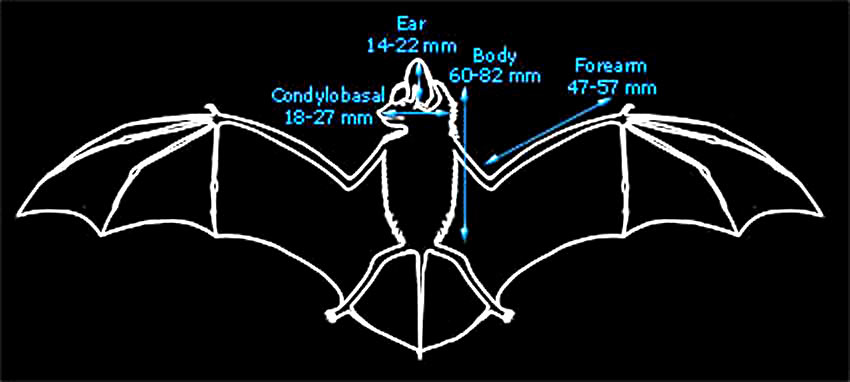
The diagram below gives important average body measurements for serotines (Greenaway & Hutson, 1990).
|
Back to top |
Life History
- Mate from the end of August to early spring.
- One offspring is born towards the end of June.
- Maximum age recorded in Europe is 19 years 3 months (Schober & Grimmberger, 1989).
Back to top
|
Distribution |
|
|
 |
| The British and World distributions are shown by the white areas of the maps above (as given by Richardson, 2000 and Corbet & Harris, 1991 respectively). |
|
Common in the south of England.
Back to top
|
Habitat |
|
- Serotines prefer open habitats and rivers or lakes (Vaughan et al., 1997).
- Often found in buildings at the edges of towns.
- The photograph on the left shows a typical habitat of serotines.
|
| Roost Sites and Patterns |
- Summer roosts: females are found in nursery roosts of 15-30 individuals from March to the end of August (Hutson, 1991).
Males are solitary throughout the year. Roost in old buildings dating to pre-1900 with cavity walls.
- Robinson & Stebbings (1997) found that the nursery roosts of serotines that contained less than 20 individuals had home ranges of 24-77 square km, with central areas of high activity of 13-33 square km. There was an average density of one bat per 120 hectares, although this density would be higher had the non-breeding and juvenile bats been included in the calculation. Serotine travelled an average of 8 km a night between their foraging sites.
- Winter roosts: cavity walls, chimneys and under the floors of old buildings and caves.
- Occasionally found in tree holes and rarely bat boxes.
- May share roosts with pipistrelles.
Back to top
|
Emergence and Flight Pattern |
- Median emergence time is 20 minutes after sunset (Jones & Rydell, 1994).
- Serotines alter their emergence pattern seasonally. Catto et al. (1995) found that in early summer the activity of serotines was unimodal. When the bats were pregnant the activity became bimodal, and from mid-lactation the activity was multimodal. After lactation patterns then returned to unimodality. These findings indicate that reproductive state can affect activity patterns. Low temperatures were found to suppress activity.
- Flies slowly and leisurely, but agile.
- Flies up to 30m above ground level (Hutson, 1991).
- Flies mainly at treetop height to foraging site.
- At the start of the season the bats return to their roosts 30-40 minutes after their first emergence (Hutson, 1991).
- Petrzelkova & Zukal (2003) found that the presence of a barn owl outside the roost at the time of emergence had no effect on the emergence pattern of serotines, with the exception of their clustering behaviour. Pregnant bats clustered more closely when emerging when a barn owl was present and continued to cluster for several subsequent nights. This suggests that clustering on emergence is a predation avoidance strategy.
Back to top
|
Foraging Behaviour |
- Foraging activity peaks at the start of the night, and there is a second period of activity around dawn.
- Serotines commute on average 6.5km to and from feeding areas per night, and use up to 5 areas each night. Serotines use three main feeding strategies: short flights, ground feeding and mainly aerial hawking (Catto et al., 1996).
- Forages 0-5m above ground level (Russ, 1999).
- The diet of serotines mainly consists of Coleoptera, with both crepuscular and diurnal species being eaten. Tympanate species are also taken. Lepidoptera and Diptera are also part of the serotine's diet. Hawking and gleaning foraging strategies are used (Vaughan, 1997).
- Robinson & Stebbings (1993) investigated the diet of the serotine. They found that in 96.1% of the faeces they examined Coleoptera were present and in 14.7% Lepidoptera were present. The beetle species found were from habitats such as hay meadows or grazed pasture indicating that this population of serotines foraged mainly over these habitat types.
- Catto et al. (1994) found that the most common prey item of serotines was Aphodius beetles. The bats consume the greatest diversity of prey items in June.
|
 |
|
Marked in blue on the diagram above is a typical foraging path of serotines (based on Russ, 1999).
Back to top
|
Echolocation Calls |
|
|
|

|
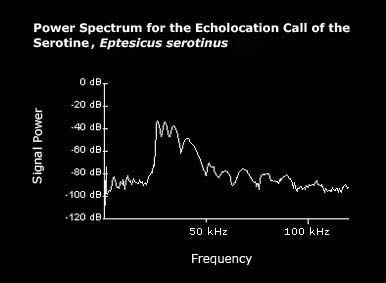
The echolocation call of serotines is constant frequency. |
|
To listen to the call of the serotine click here
Size of sound file: 45.4 KB
|

|
| For details of how the echolocation calls were recorded click here. |
|
Average values for a serotine echolocation call, as given by Vaughan et al. (1997), are listed below:
Interpulse interval: 116 ms
Call duration: 5.22 ms
Minimum frequency: 27.7 kHz
Maximum frequency: 57.4 kHz
Prior to emergence social calls are made for approximately half an hour.
|
Back to top
|
|
| Status and Protection
- The pre-breeding population was estimated at 15,000 in 1995 (14,750 in England, 250 in Wales) (Harris et al., 1995).
- Populations are declining, although some evidence suggests that the range may be increasing northwards.
- Serotines are at low risk of extinction worldwide (IUCN status, 2001).
- Use of chemical wood treatments, human disturbance and destruction of roost sites are blamed for decreases in abundance.
- Reducing the use of chemicals toxic to vertebrates will help maintain existing populations.
Back to top
|
 © School of Biological Sciences, University of Bristol 2005. Last modified 24th February 2005. © School of Biological Sciences, University of Bristol 2005. Last modified 24th February 2005. |